

Intro
I have followed exchanges since 2010, when I began a role as a FIG (Financial Institutions Group) investment banker in NY focused mostly on the market structure sub-sector. I continued to follow the sector and actively invest in it after moving to the buyside and starting Upslope. While I have been a generalist at Upslope, exchanges have been a major part of the firm’s strategy, which is approaching its 10-year anniversary this fall. More than any other group of stocks, I have had a long bias towards exchanges. I love the dual “long-vol” + secular growth characteristics that many exchanges are exposed to. At various points, Upslope has been long: CBOE, CME Group, Japan Exchange Group, MarketAxess, NEX Group, TMX Group, and others. Less frequently and in much smaller size, Upslope has had exchange-related shorts.
Abaxx Data
When I first heard of Abaxx Technologies (ABXX:TO) on May 19 (I remember the X post!), I was immediately intrigued. Abaxx is a Toronto-listed operator of a new commodity futures exchange based in Singapore. Effectively, it aims to compete with or supplement pieces of ICE and CME (Upslope currently owns shares in the latter).
While I was initially focused on the corporate governance side of things at Abaxx due to the CEO’s interesting behavior on X toward even the mildest of skeptics, the focus more recently and in this piece is data. The analysis below is Upslope’s own synthesis and interpretation of data directly from Abaxx.
* * * * *
A few notes upfront: Upslope and its clients are currently short shares of Abaxx and stand to benefit if shares fall. Also note the disclaimer at the end of this post. Additionally, it should be acknowledged the activist short-seller Viceroy published a widely discussed short report last week. Upslope has no past or present affiliation with Viceroy or any of its employees, and nothing here should be read as an endorsement (or rebuttal) of their work – readers are encouraged to reach their own conclusions.
Quick Background
In March of this year, volumes on Abaxx’s exchange began ramping from a couple thousand to 20k contracts/day and up. The company and its supporters have repeatedly touted volume growth and records – even while acknowledging the exchange is still in “pilot” mode. As volumes rose, valuation took off too – peaking near C$2bn in market cap and ~100x 2026E revenues at one point. Management has acknowledged that, like most upstart exchanges, trader incentives are playing a role in getting volumes up and running.
If you look at Abaxx’s daily trading reports, one thing becomes immediately apparent: most of the volume doesn’t look like standard, directional trading. They largely appear to be (A) calendar spreads (e.g. buying 122 June gold futures and simultaneously selling 122 September gold futures) that are (B) opened and closed the same day. As a result, open interest (“OI” – futures positions held overnight) has been minuscule since inception, despite ramping volumes. In Upslope’s view, this suggests a fair amount of dependence on incentives. I’m open-minded, but it’s hard to understand why traders would otherwise engage in this almost every day – it seems like a lot of effort and commissions for not much profit potential (calendar spreads are very low risk – especially not holding overnight).
While there’s absolutely nothing wrong with incentivizing volumes, you can’t have it both ways: on the one hand leaning significantly on incentives to boost volumes while simultaneously touting volume records and implying a real ”flywheel”/network effect is kicking in. Generally speaking, it’s not particularly hard for most companies to grow sales rapidly when “selling $1.00 for $0.50.”
Methodology
The aim of this exercise was to answer the question: does trading activity increasingly look like sustainable customer activity, or is it mostly incentivized traders/market-makers (acceptable, but not a sign of true network effects taking hold)?
To try and answer this, I analyzed the daily trading data (1/1/26 - 6/17/26) from Abaxx’s exchange website to tease out commercial (read: non-incentivized) progress or lack thereof at the exchange. This data mostly includes information on volumes, open interest (OI), and daily high, low, close, and settlement prices. Using that data, I built several liquidity-related metrics and a “liquidity quality” composite. While the metrics are somewhat overlapping in nature, the fact they are derived from different figures and calculations and all tell the same story gives me confidence in the thesis.
Helpfully, Abaxx isn’t the only startup futures exchange right now. BGC’s FMX Exchange, though focused on a very different asset class (rates), is also in startup mode and publicly reports. Despite the business differences, running the same analysis on FMX and comparing trajectories provides a useful sanity check, in my view.
Let’s jump into each of the metrics.
Open interest and “day-traded share”
Open interest has been effectively nonexistent from the start, even as volumes have ramped. Even June’s much-celebrated “spike” brings OI to just ~10% of 10-day average volume, versus a 200-400% range at FMX. CME’s (scaled) gold futures complex also sports OI/volume in the ~300% range. Most of Abaxx’s volume, in other words, is day-traded, and OI is sub-scale regardless of whether it’s compared to another startup exchange (FMX) or a scaled competitor (CME).
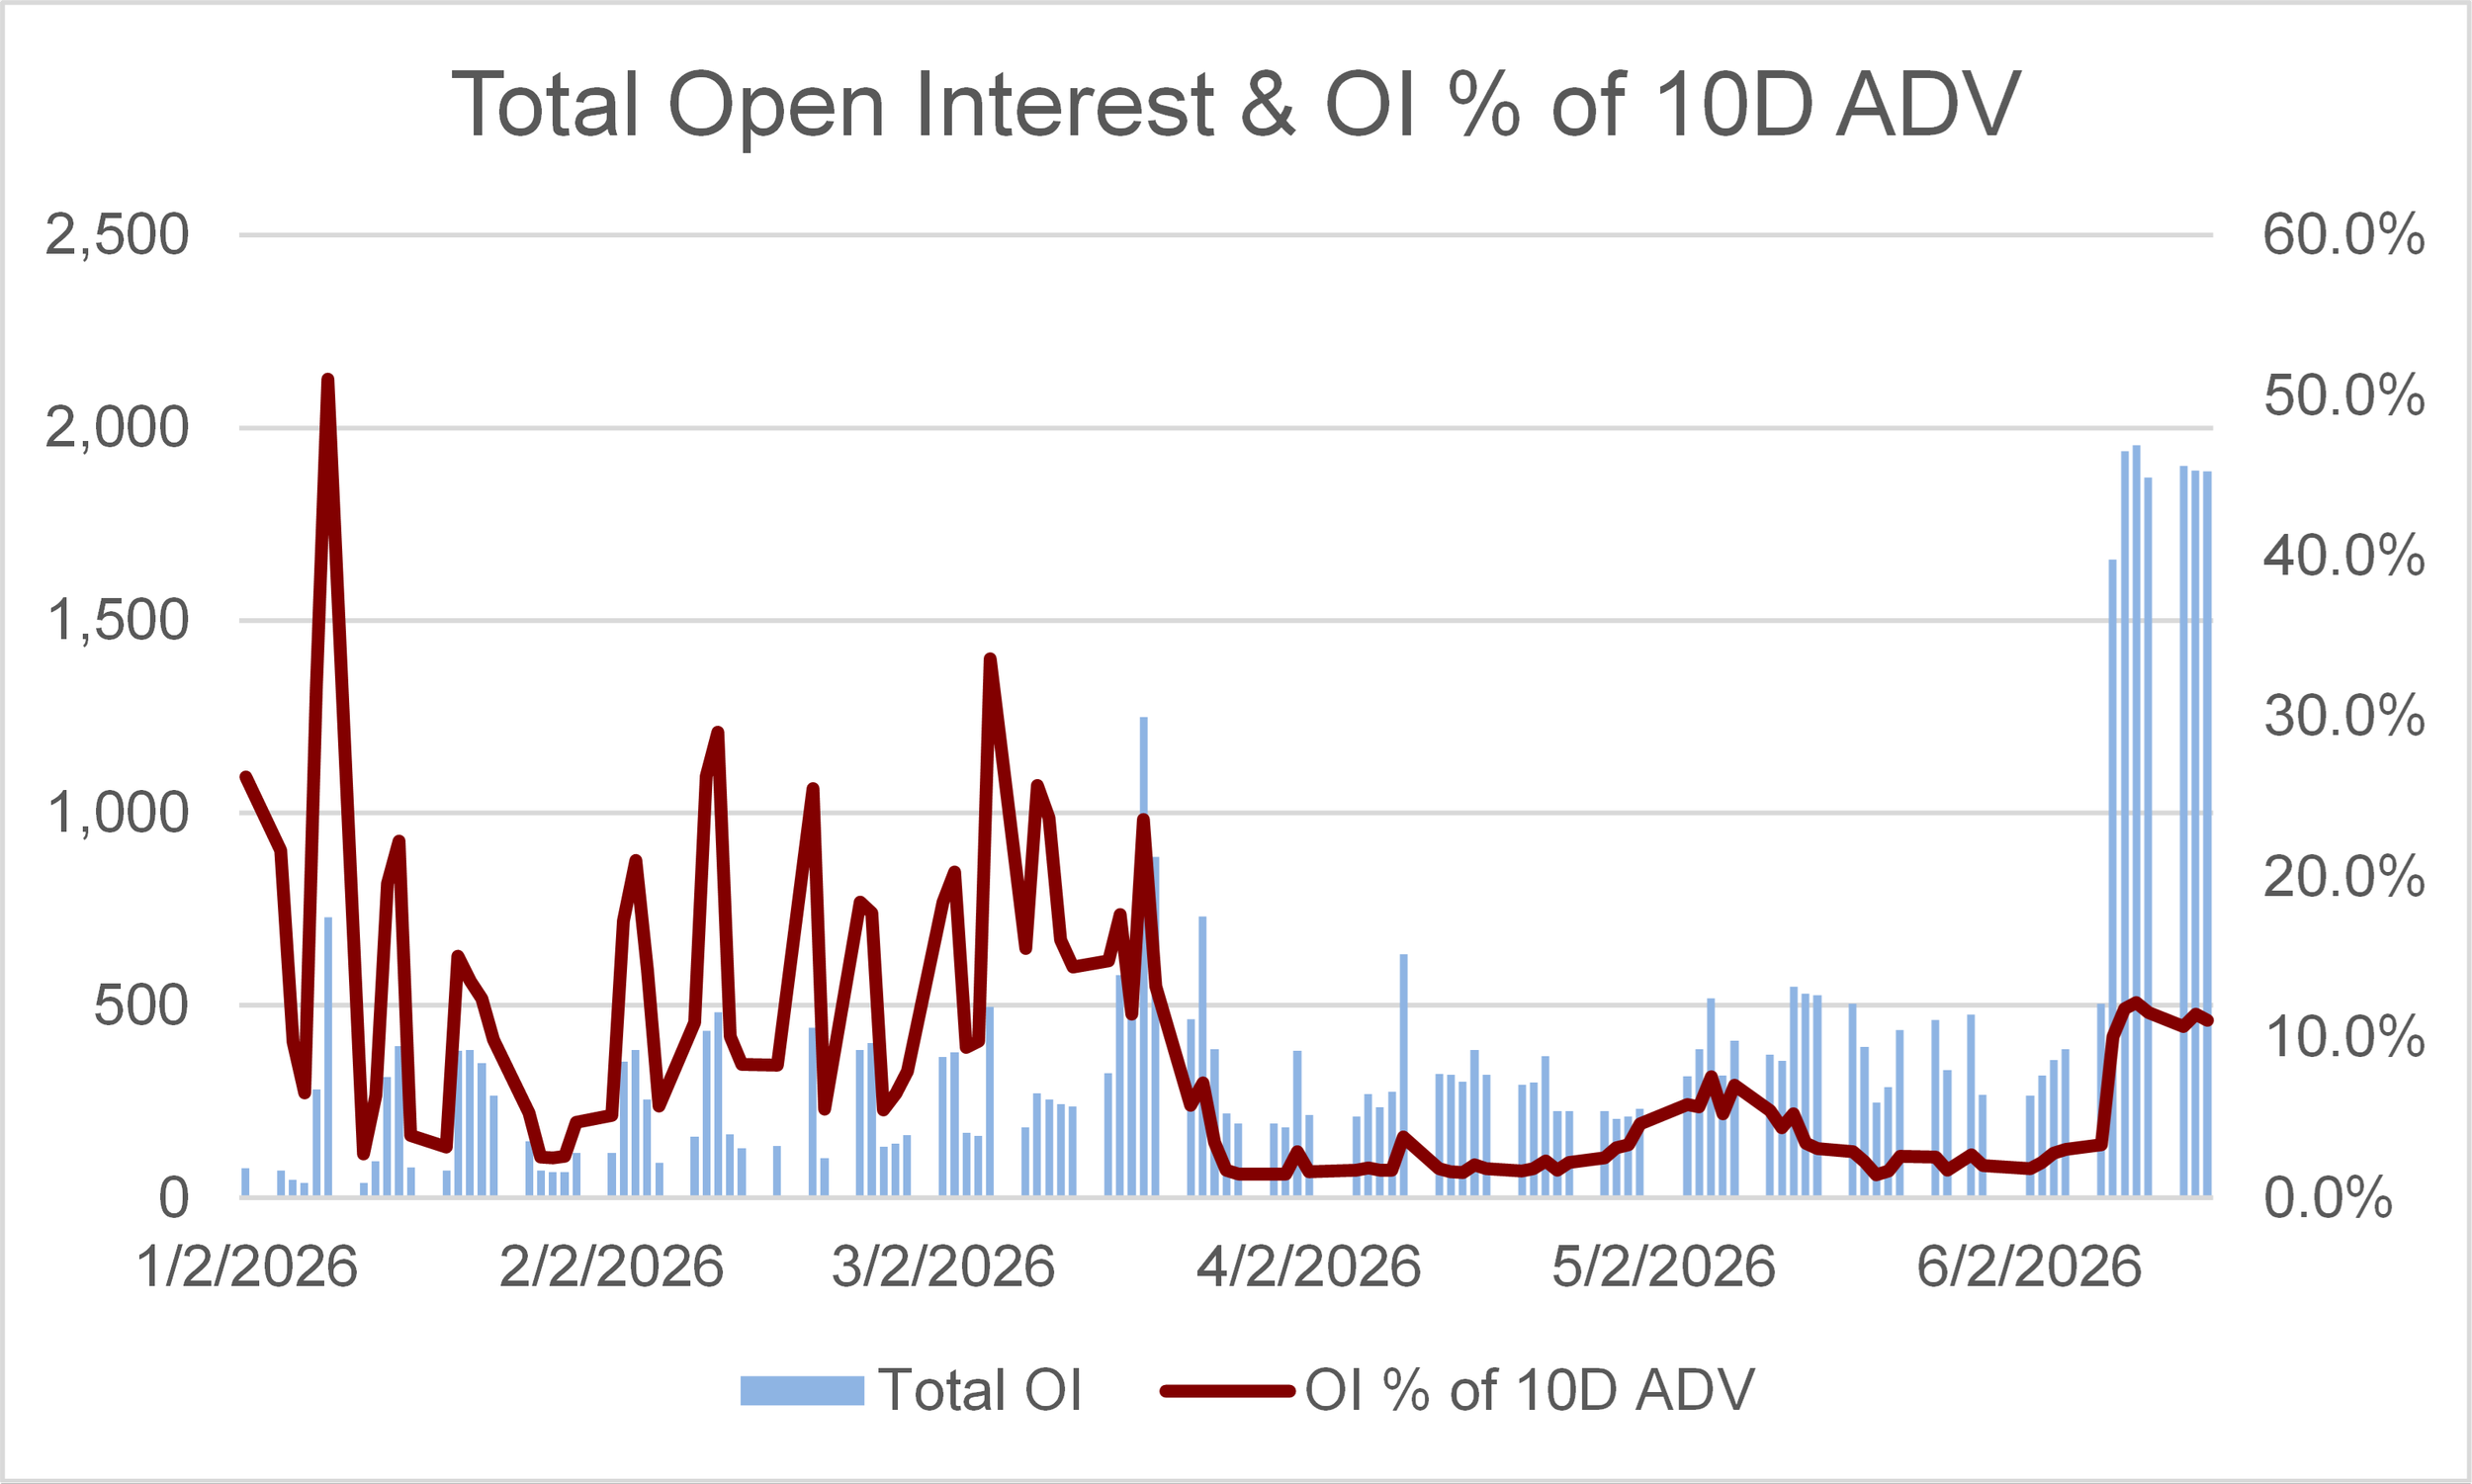
Source: Upslope chart and analysis based on Abaxx website data
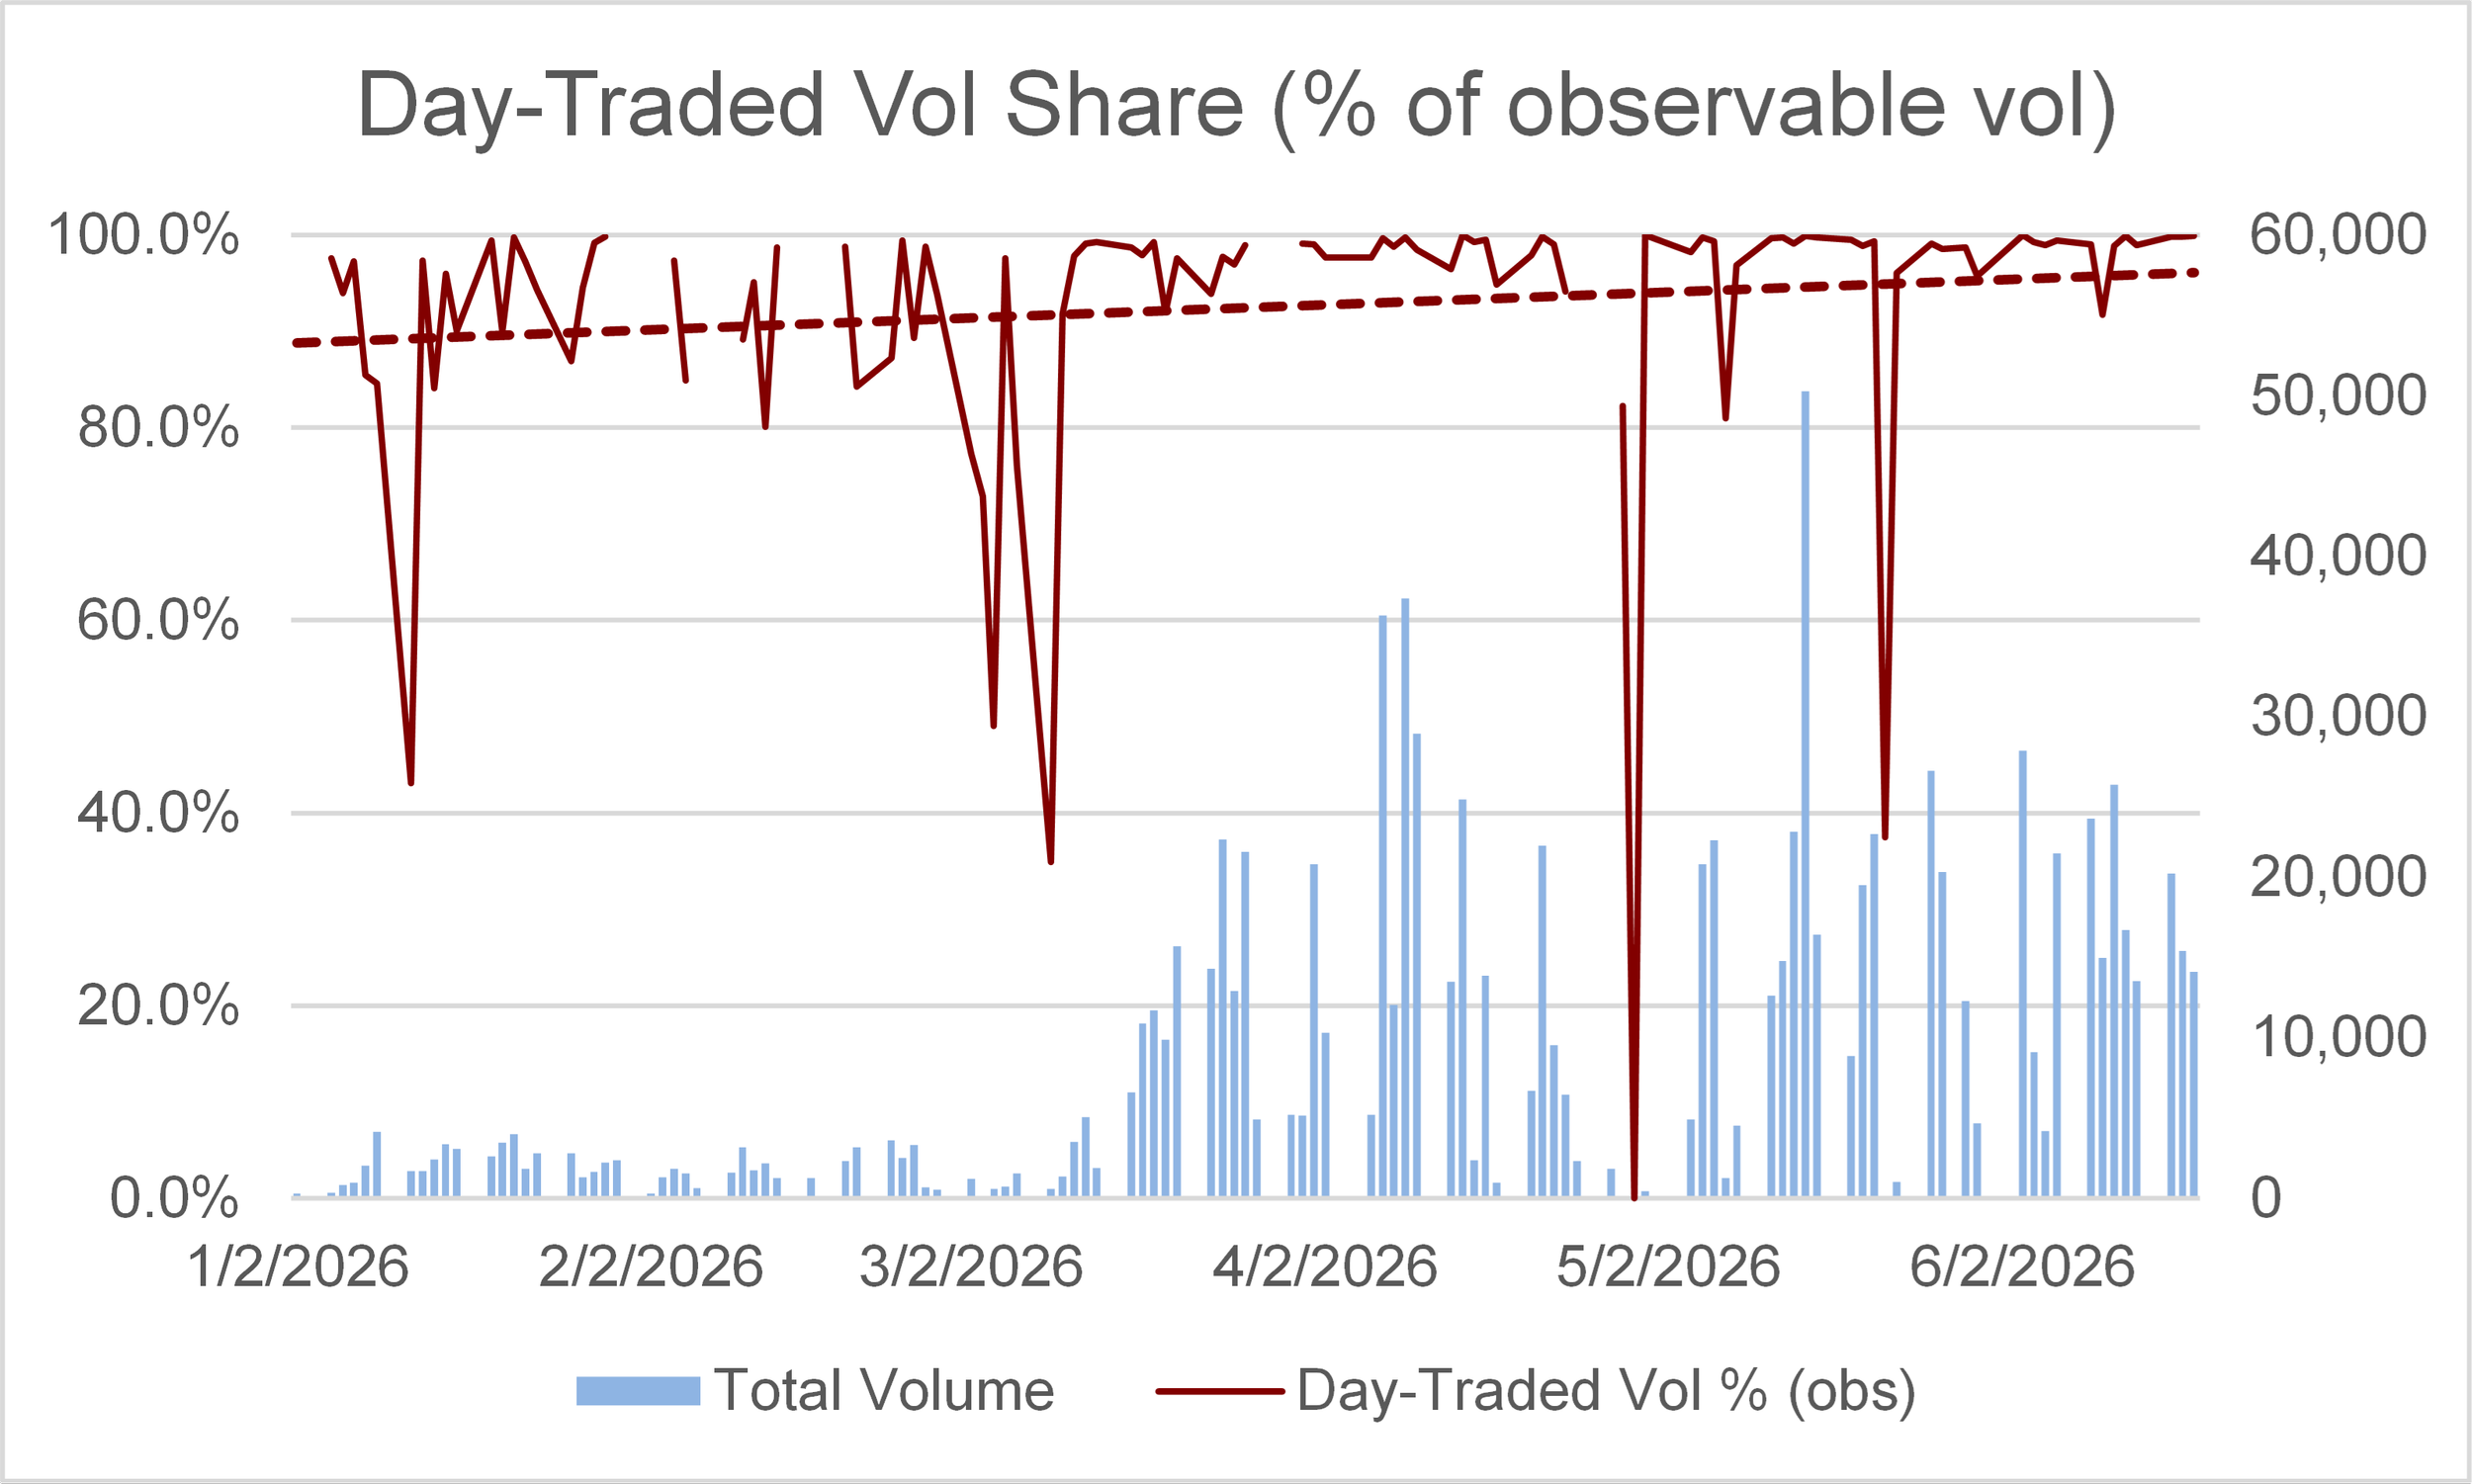
A related approach: I calculated a figure that aims to represent the portion of daily volume from “day-trading” vs. volume that actually generated a change (up or down) in OI. To do this, I compared, on a contract-by-contract basis, daily gross changes in OI to volume. The inverse of this figure gives you “day-traded share” of volume – an imperfect, but I think directionally correct figure (certainly aligns with relative OI trends). No surprise, but on most days nearly 100% of Abaxx volume is “day-traded.” This figure has not improved despite rising headline volumes.
Source: Upslope chart and analysis based on Abaxx website data
Note: Down-spikes generally occurred on abnormally low volume days (~2k lots on average). “Obs” = observable, as there are some data issues that make a sub-segment of data unobservable for this exercise.
“Settle-out share”
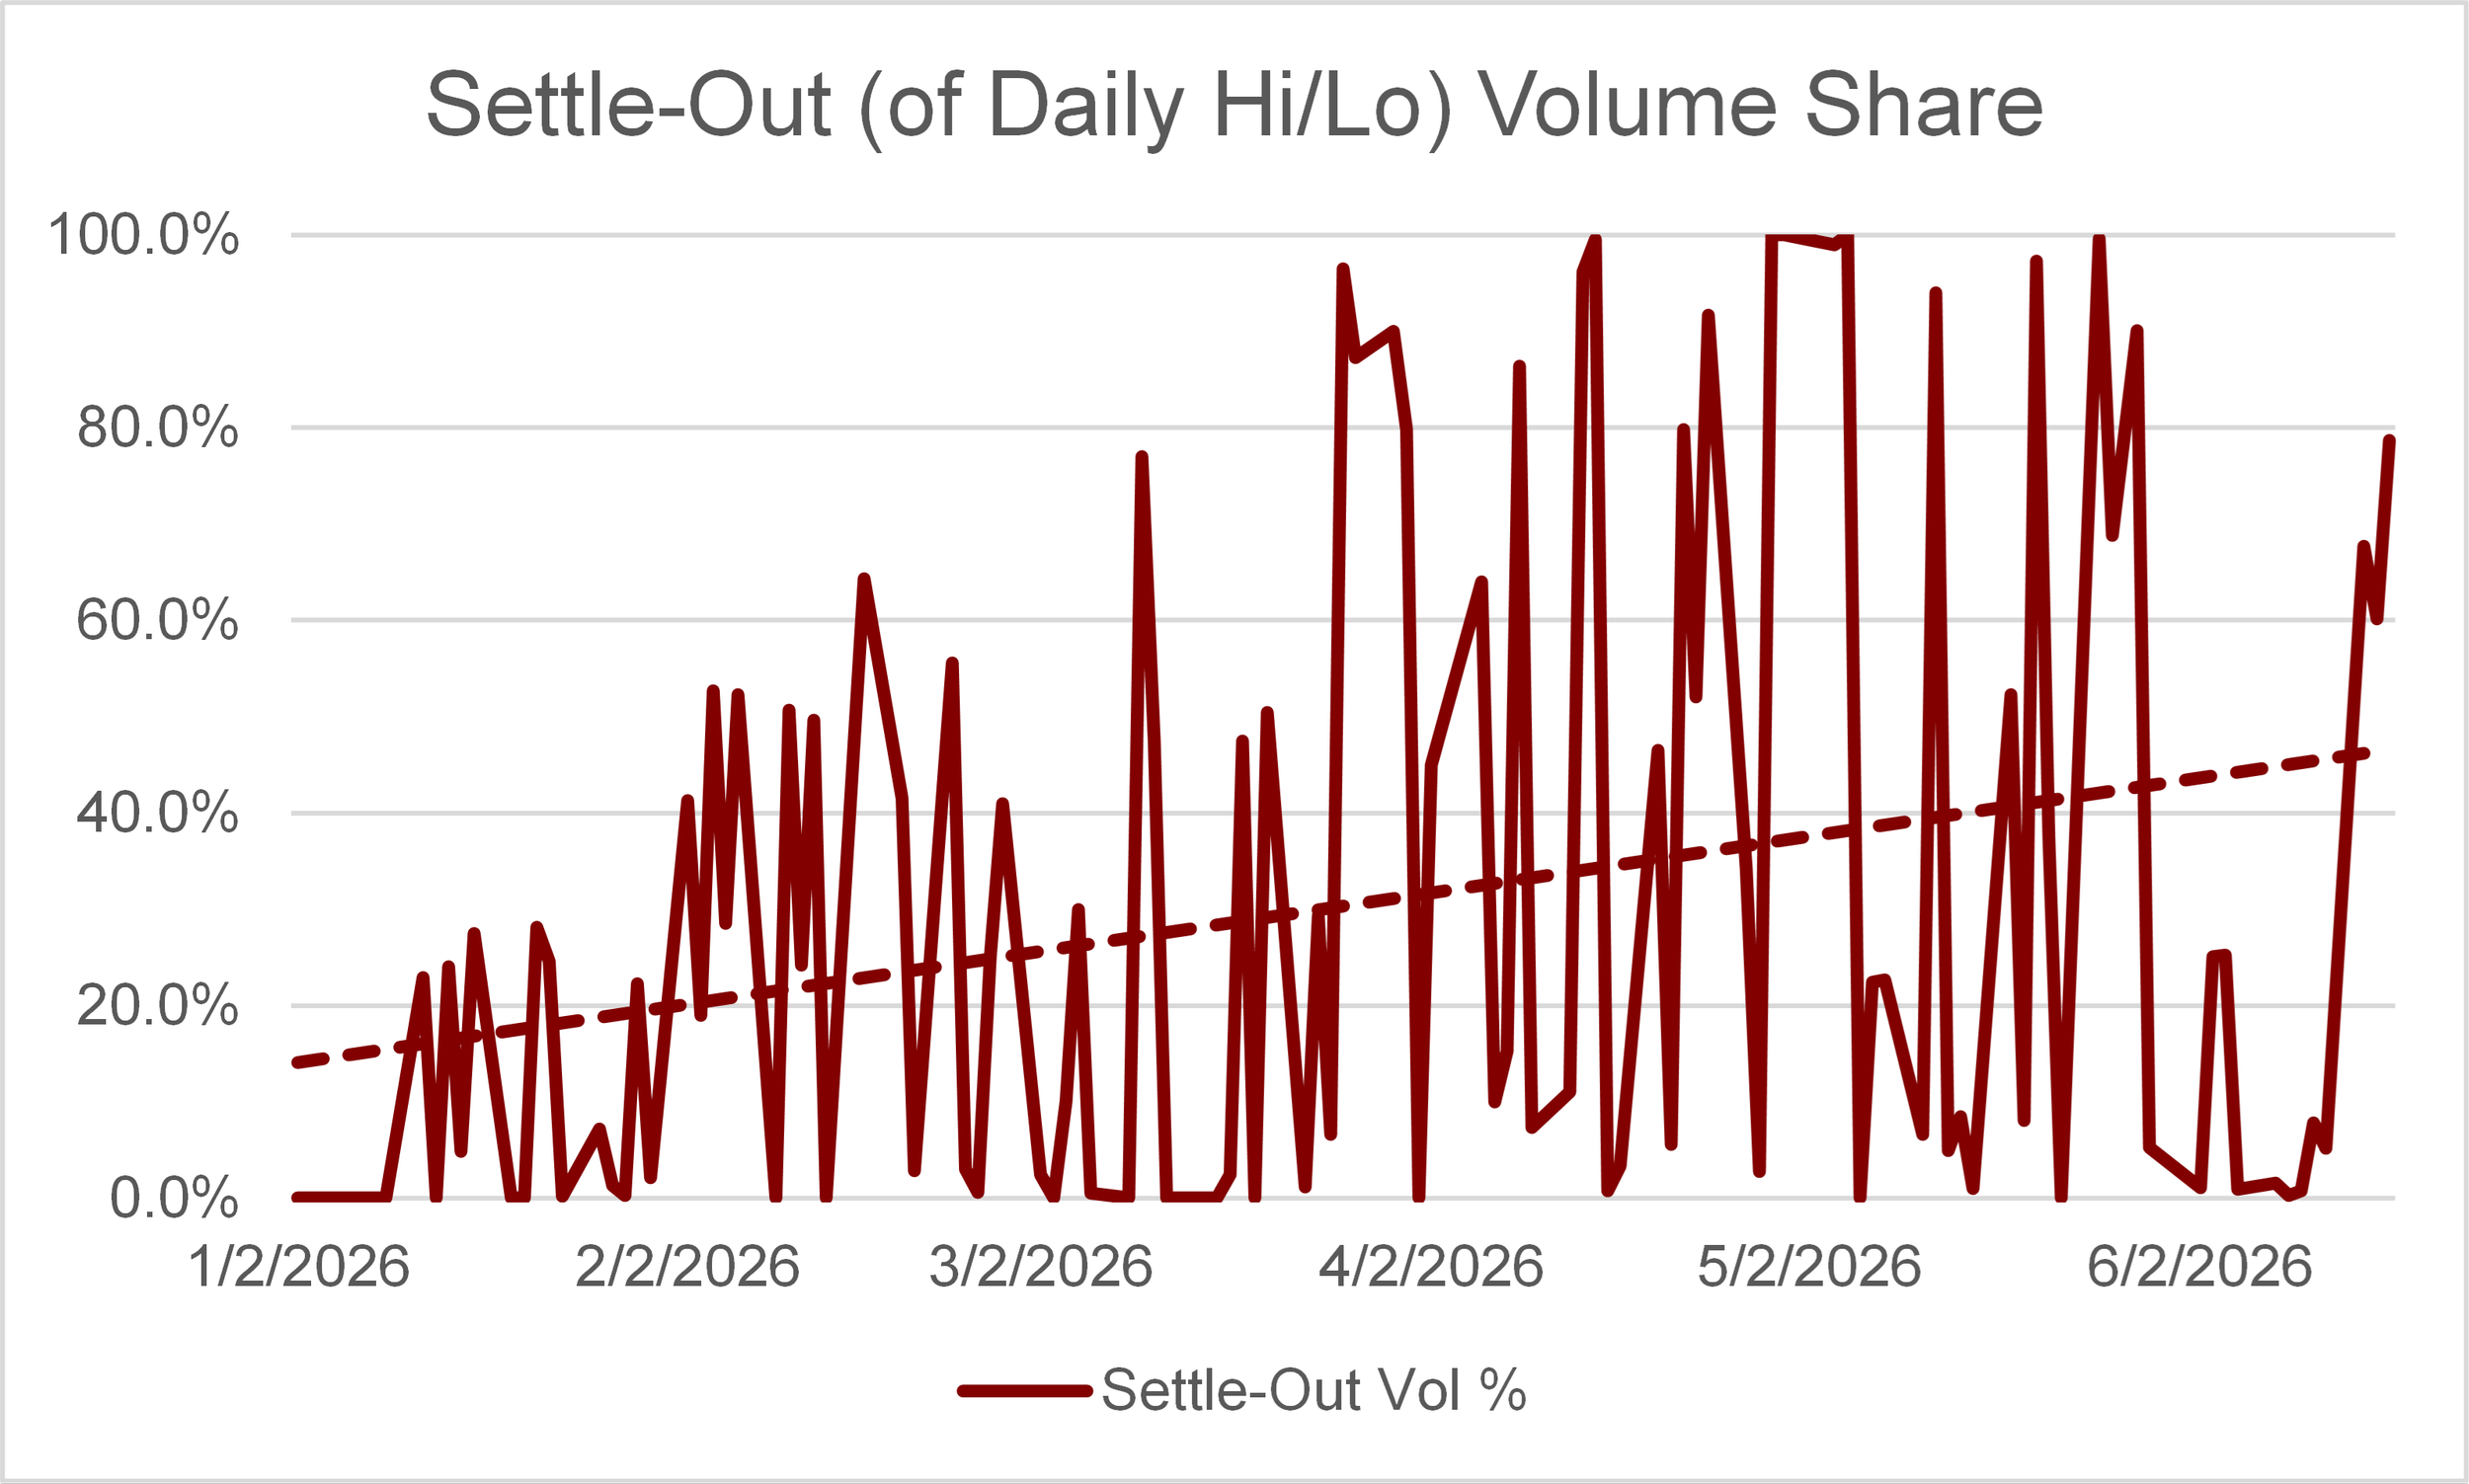
In my opinion, this is the most intriguing figure. On many days, a very large share of total volume (nearly 100% isn’t that unusual) trades in contracts that settled outside their daily on-exchange range. This would be as if Abaxx’s US/OTC shares traded all day between $30-32, and then got marked at $33 at the close. This quirk isn’t unusual in, for example, thinly traded outer-month futures contracts. But again, at Abaxx this isn’t confined to thinly traded contracts; it often occurs in those contributing a substantial portion of volumes.
Such a large and rising portion of Abaxx volumes exhibiting this “settle-out” characteristic is notable and, in my view, not a sign of a healthy, functioning market – let alone one progressing toward establishing multiple global benchmarks. This figure has also not improved despite rising headline volumes.
Source: Upslope chart and analysis based on Abaxx website data
As an example of one way these “outside” settlement marks can be derived, see the below screengrab from Abaxx’s LNG contract documentation. A question I would ask management: what portion of contracts marked outside of their daily trading range have been done so using “relevant market data from other sources”?
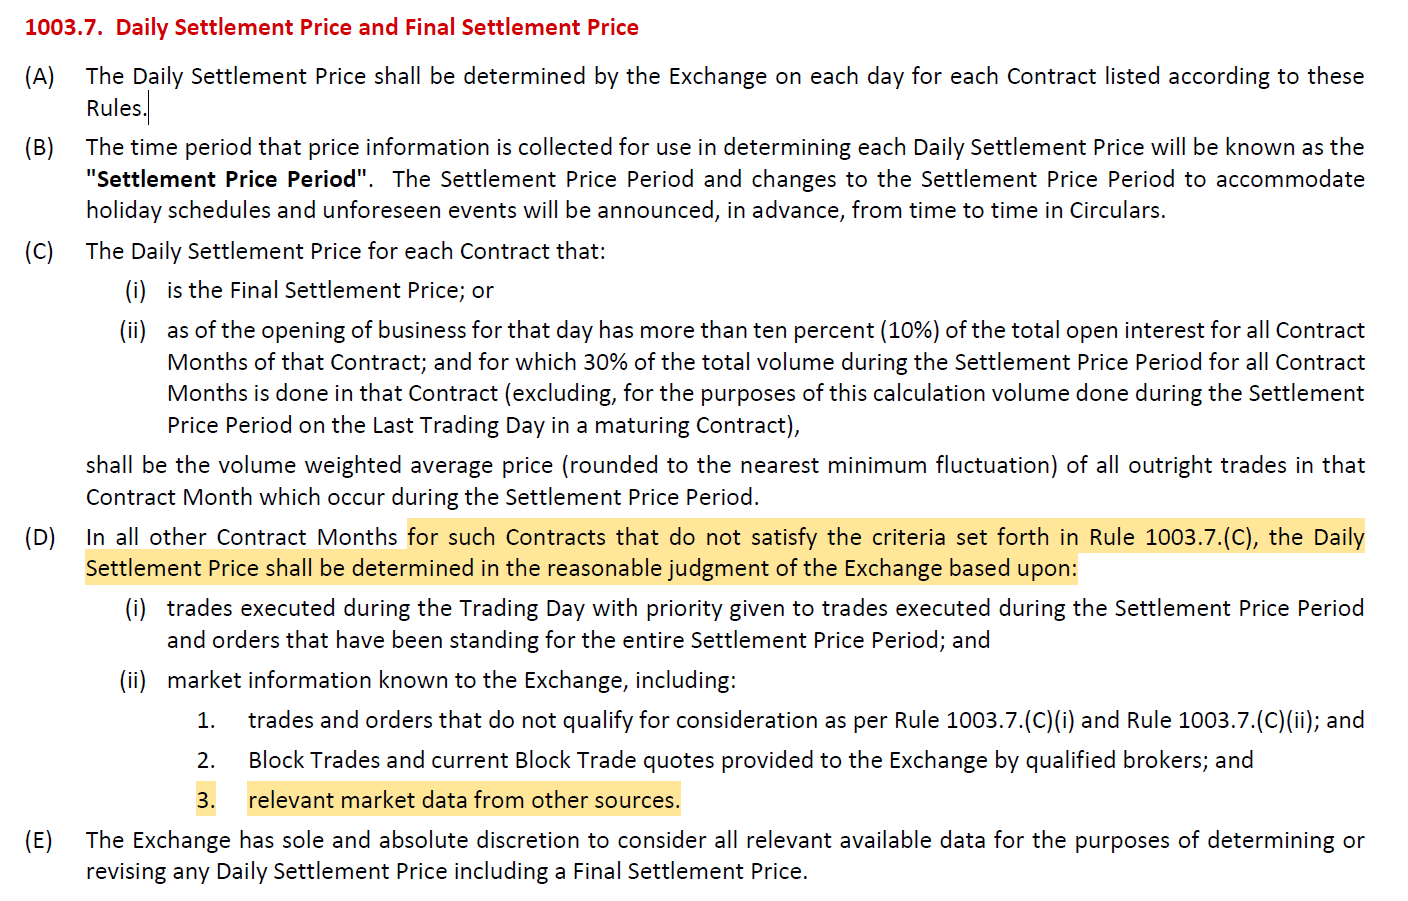
Source: Upslope, Abaxx website
“Low-range share”
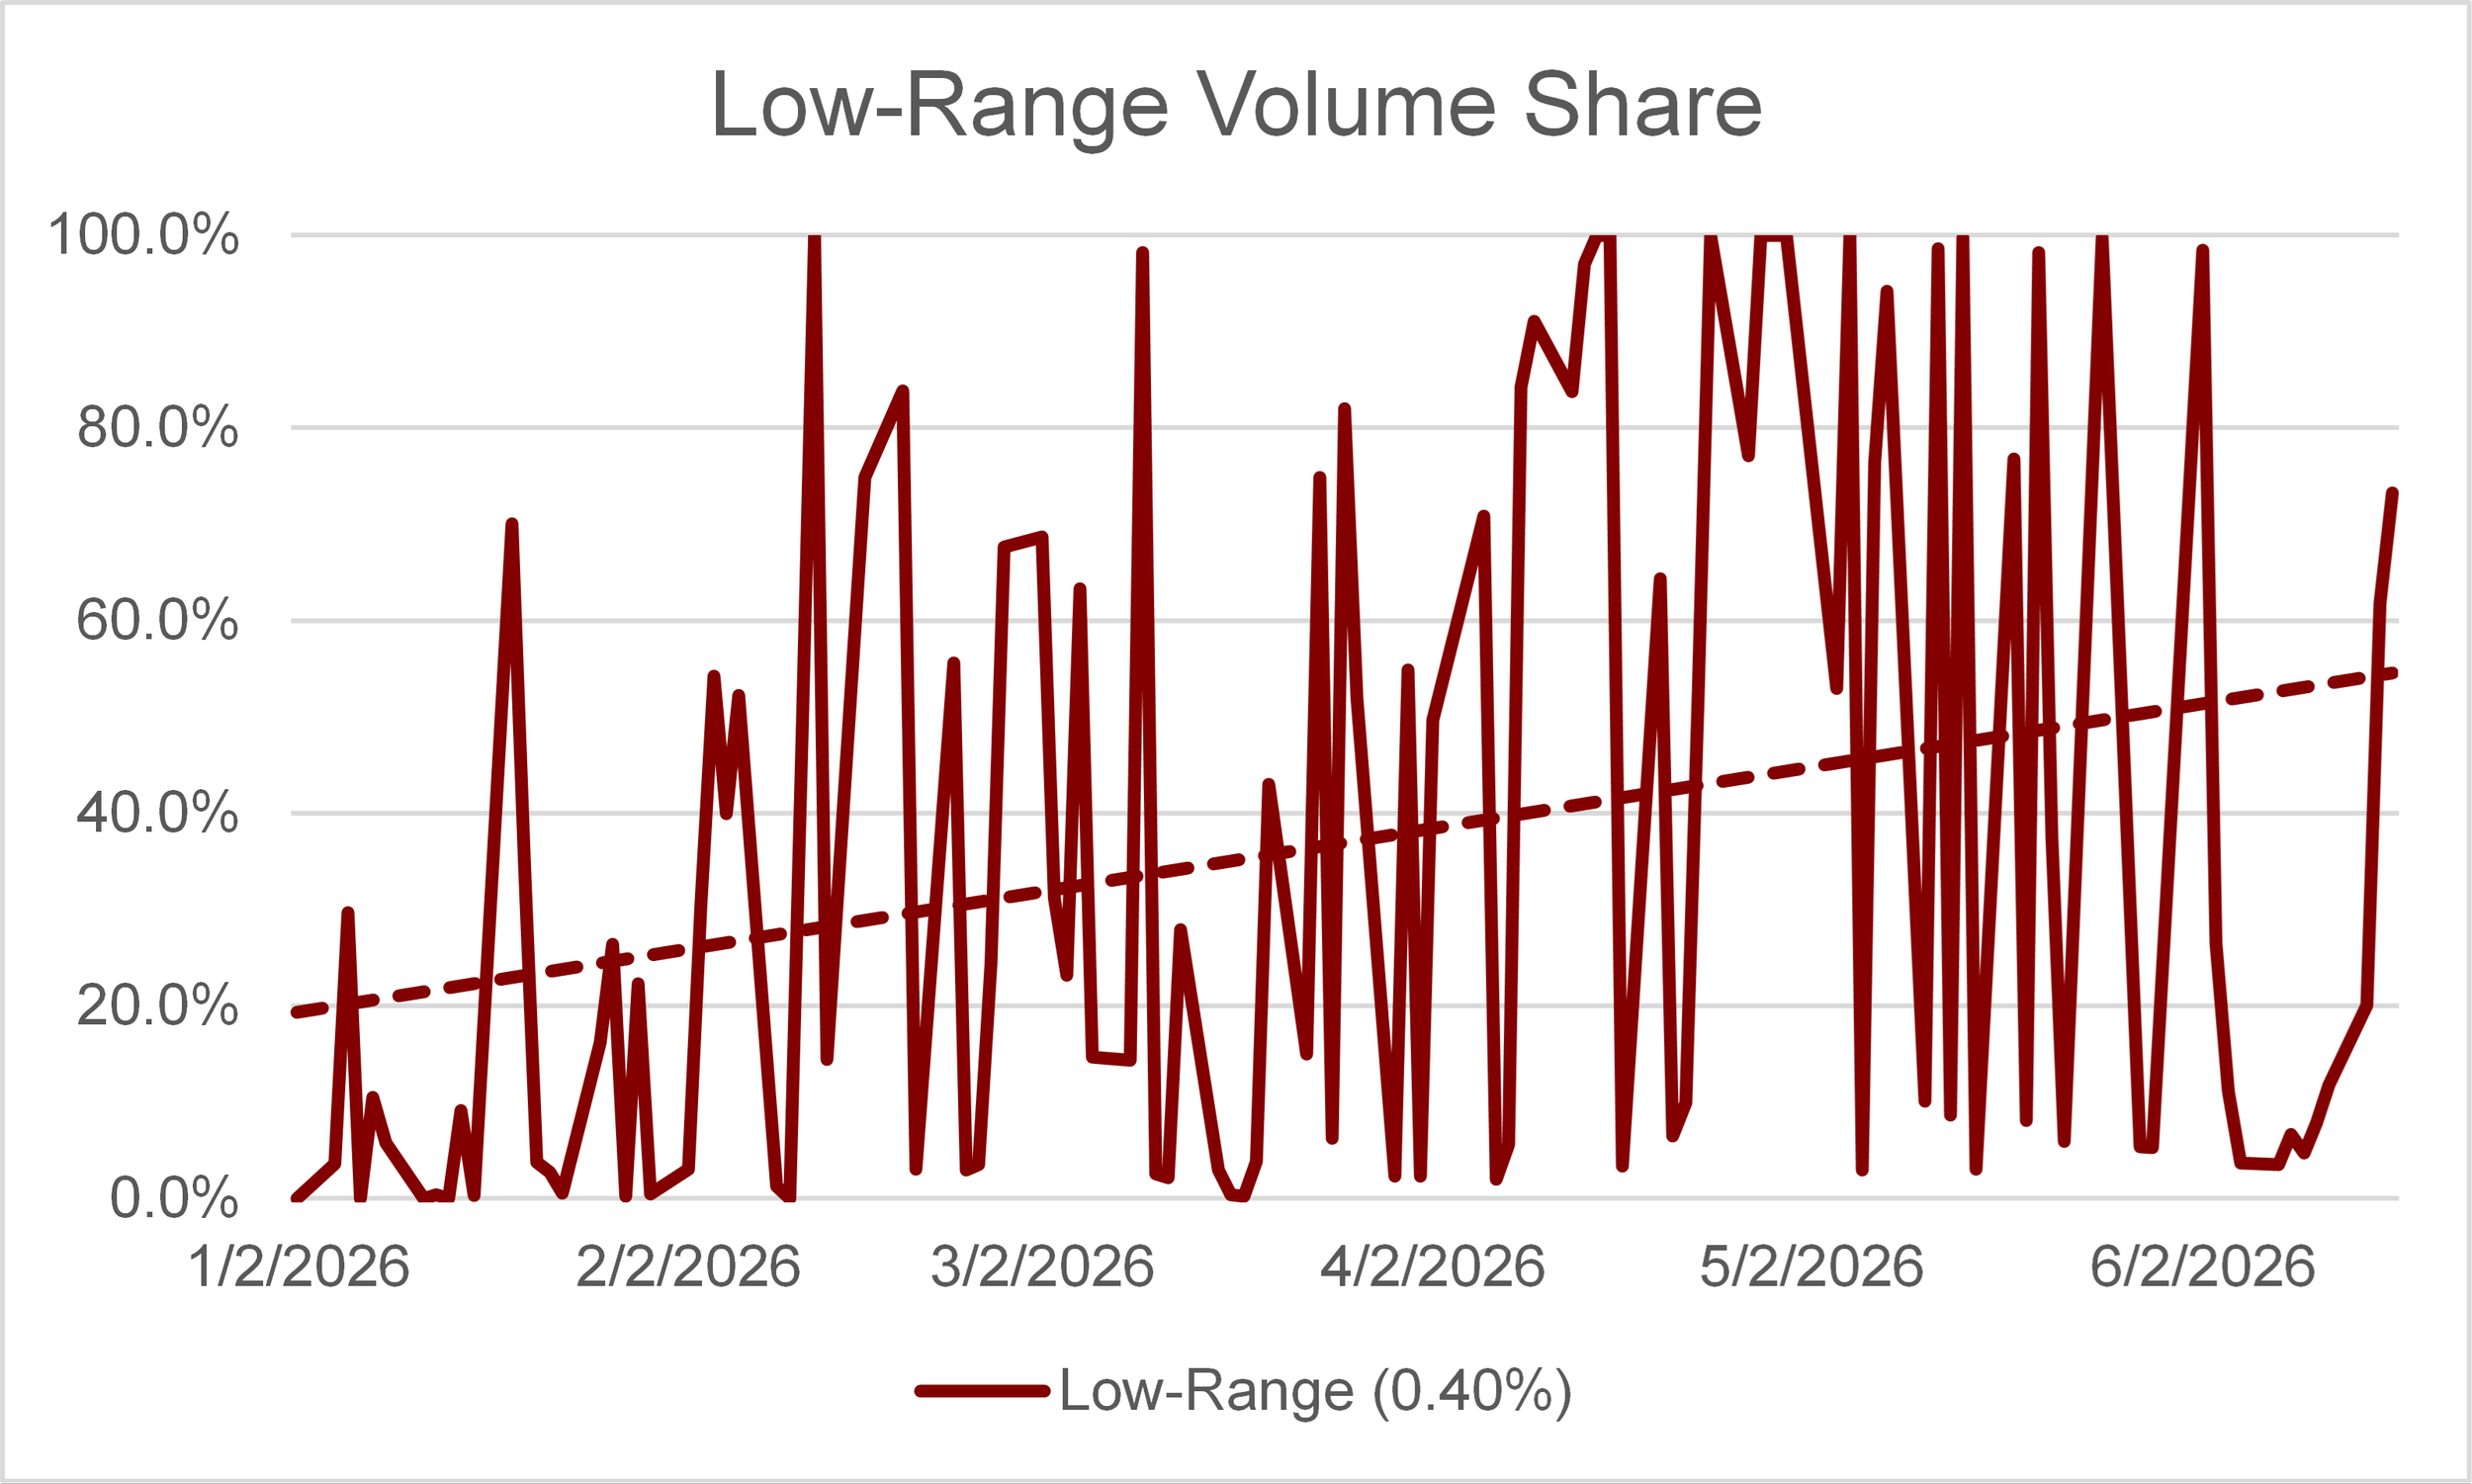
Lastly, I also analyzed the high/low price ranges for Abaxx's contracts over time. While it's not that unusual for an Abaxx contract to see a single daily price (i.e. high and low prices for a day are one and the same), I believe that considering abnormally low daily trading ranges more fully captures the essence of an exchange with poor, potentially incentive-driven liquidity.
I used a 0.40% intraday price range as the definition of “low-range.” This is roughly the 5th percentile for GLD (gold represents most of Abaxx's historic volume) over the past five years. A more typical intra-day range for GLD is almost 100 bps. Other commodities Abaxx offers (e.g. silver, nat gas) tend to be even more volatile, making 40 bps a conservative threshold. As shown below, much of Abaxx's volume often occurs in contracts with abnormally low intra-day price ranges (<40 bps). Frankly, I am unsure of the driver of this unusually low intra-day volatility. Regardless, the publicly available data seems odd to me, and again we have another liquidity figure that has not improved despite rising headline volumes.
Source: Upslope chart and analysis based on Abaxx website data
“Liquidity quality” composite
Bringing it all together, I combined the three related metrics – Day-Traded, Settle-Out, and Low-Range shares – into a “Liquidity Quality” composite (= 1 − simple average of three scores).
The theory is that if rising volumes should naturally bring better liquidity and genuine price discovery, this Liquidity Quality Composite should rise with volumes. But, no surprise at this point: “Liquidity Quality” has done the opposite at Abaxx. This suggests, in my view, that incremental volume is “lower quality,” potentially due to increasing reliance on trader incentives.
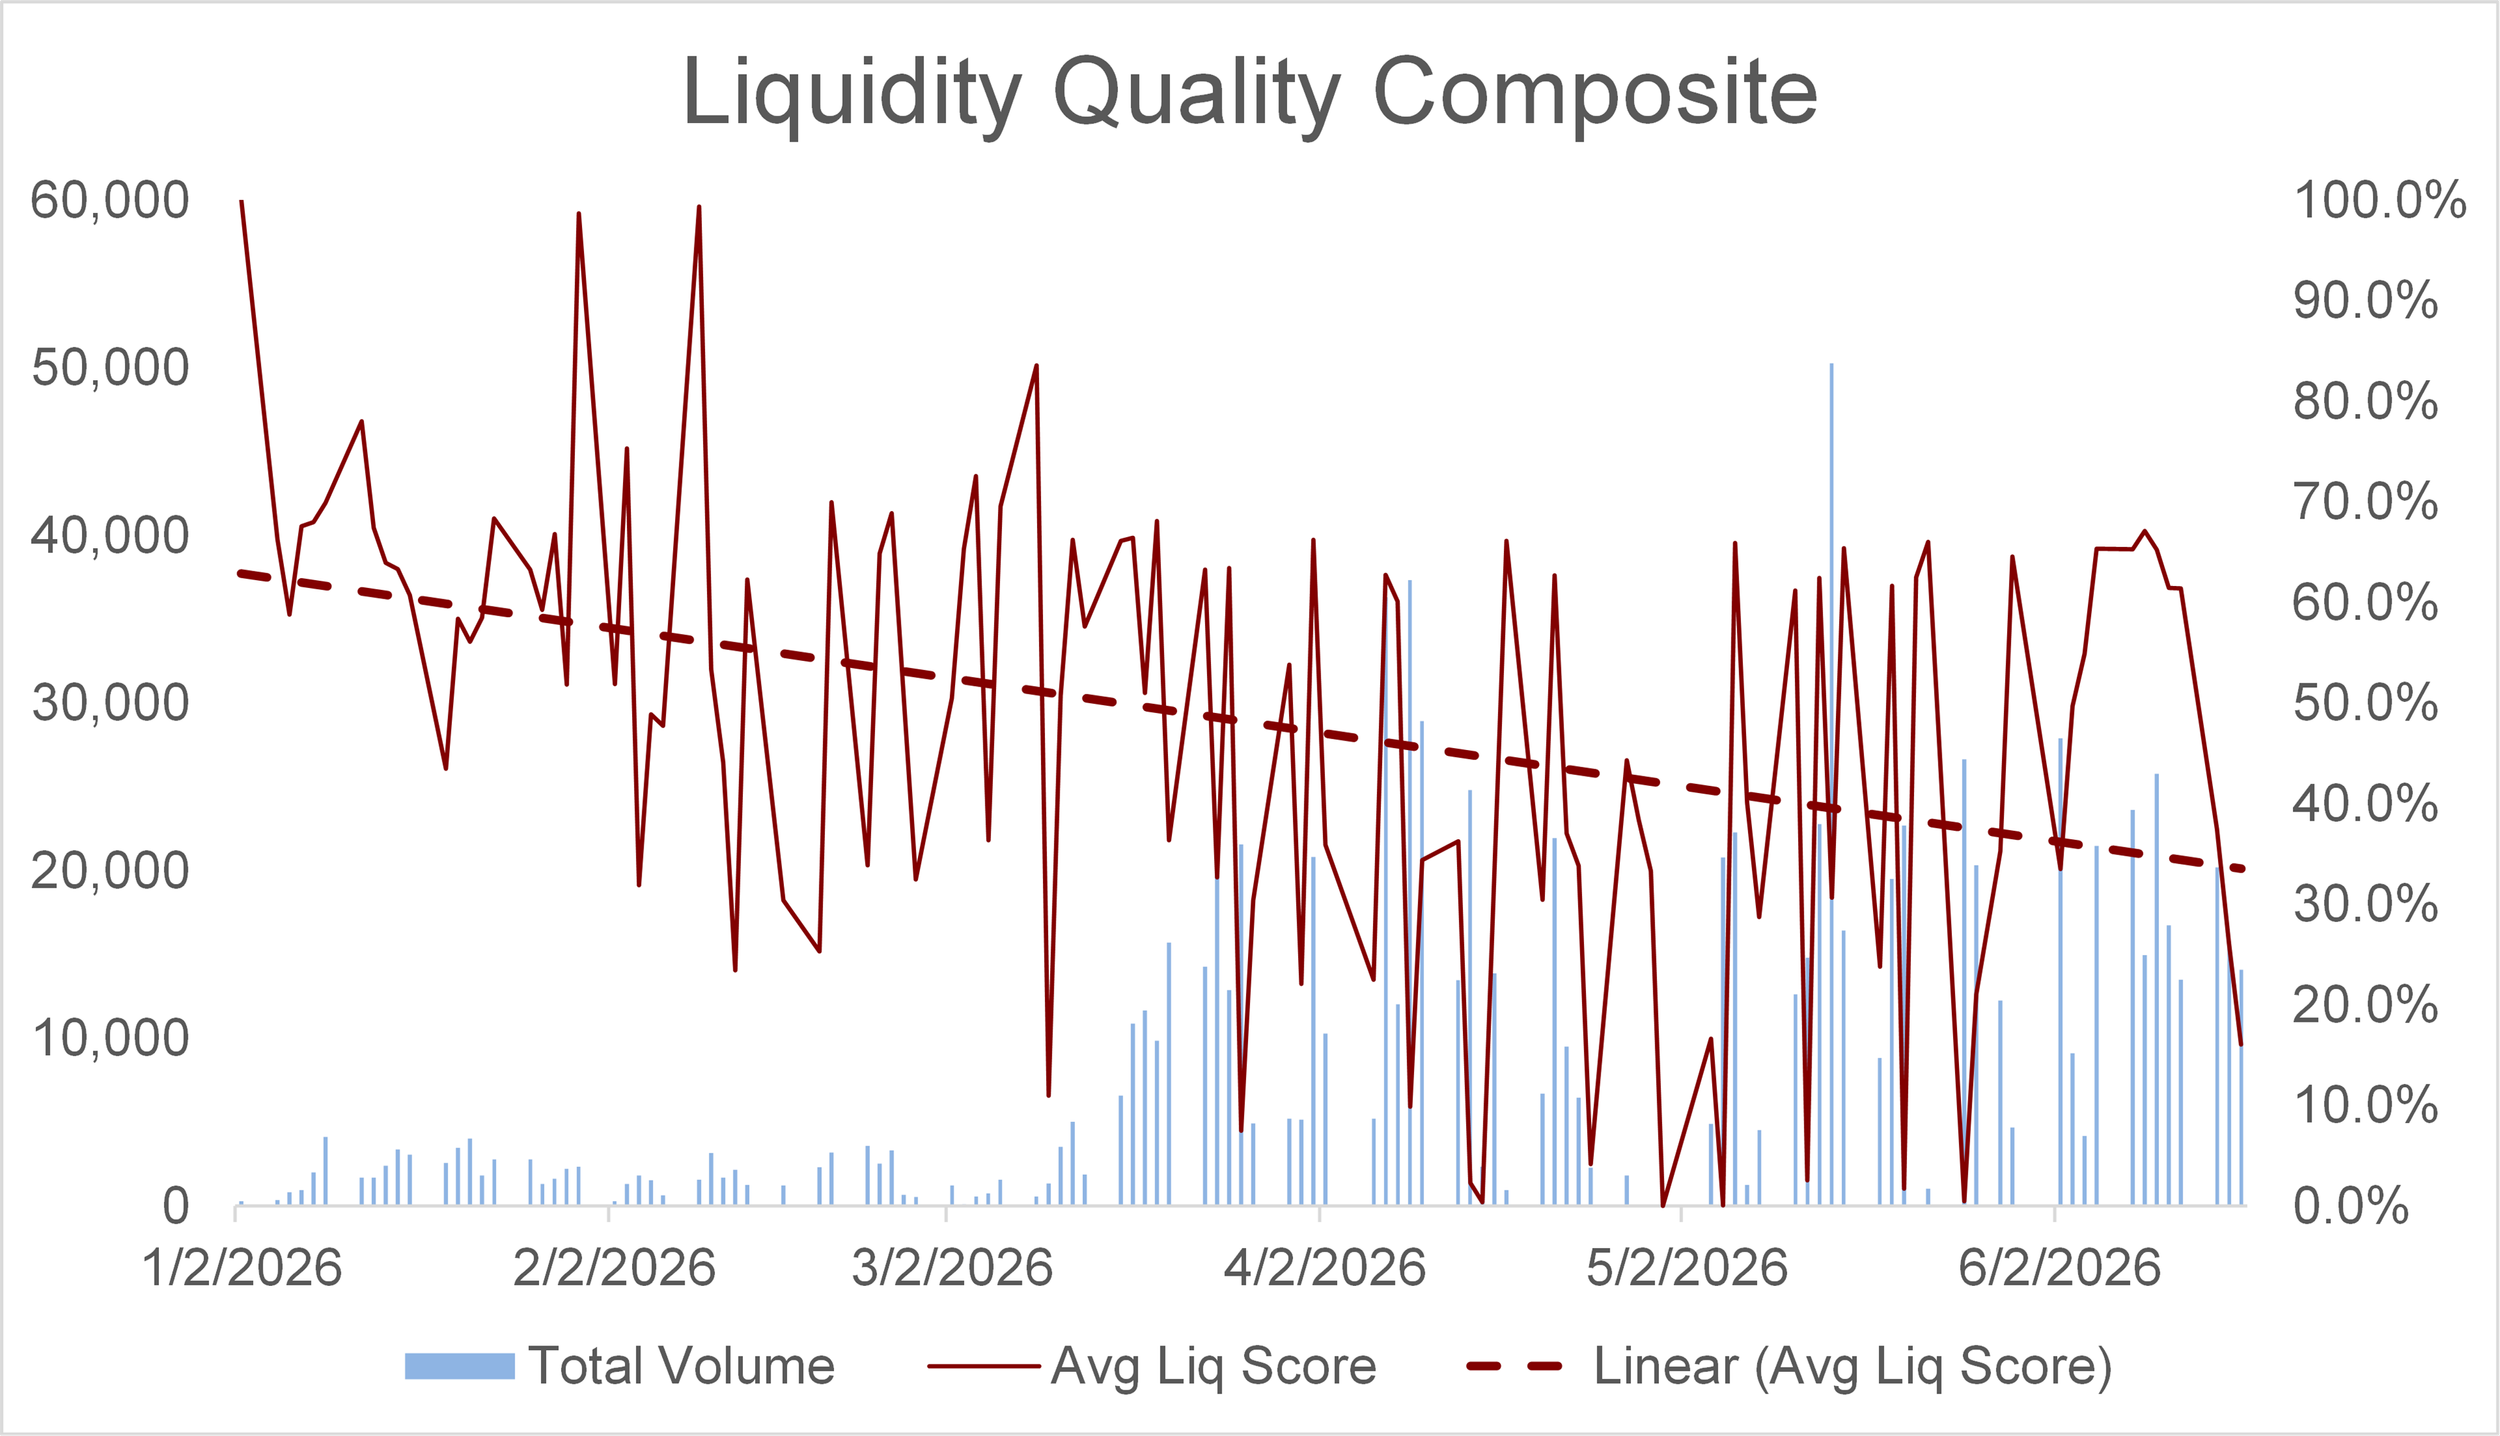
Source: Upslope chart and analysis based on Abaxx website data
As a sanity check, note that FMX’s “Liquidity Quality” composite rose over time with volumes, as one would expect. While Day-Traded Share ticked up (not good) it stayed far below Abaxx’s (~40% vs. ~99%) — and both Low-Range and Settle-Out shares improved.
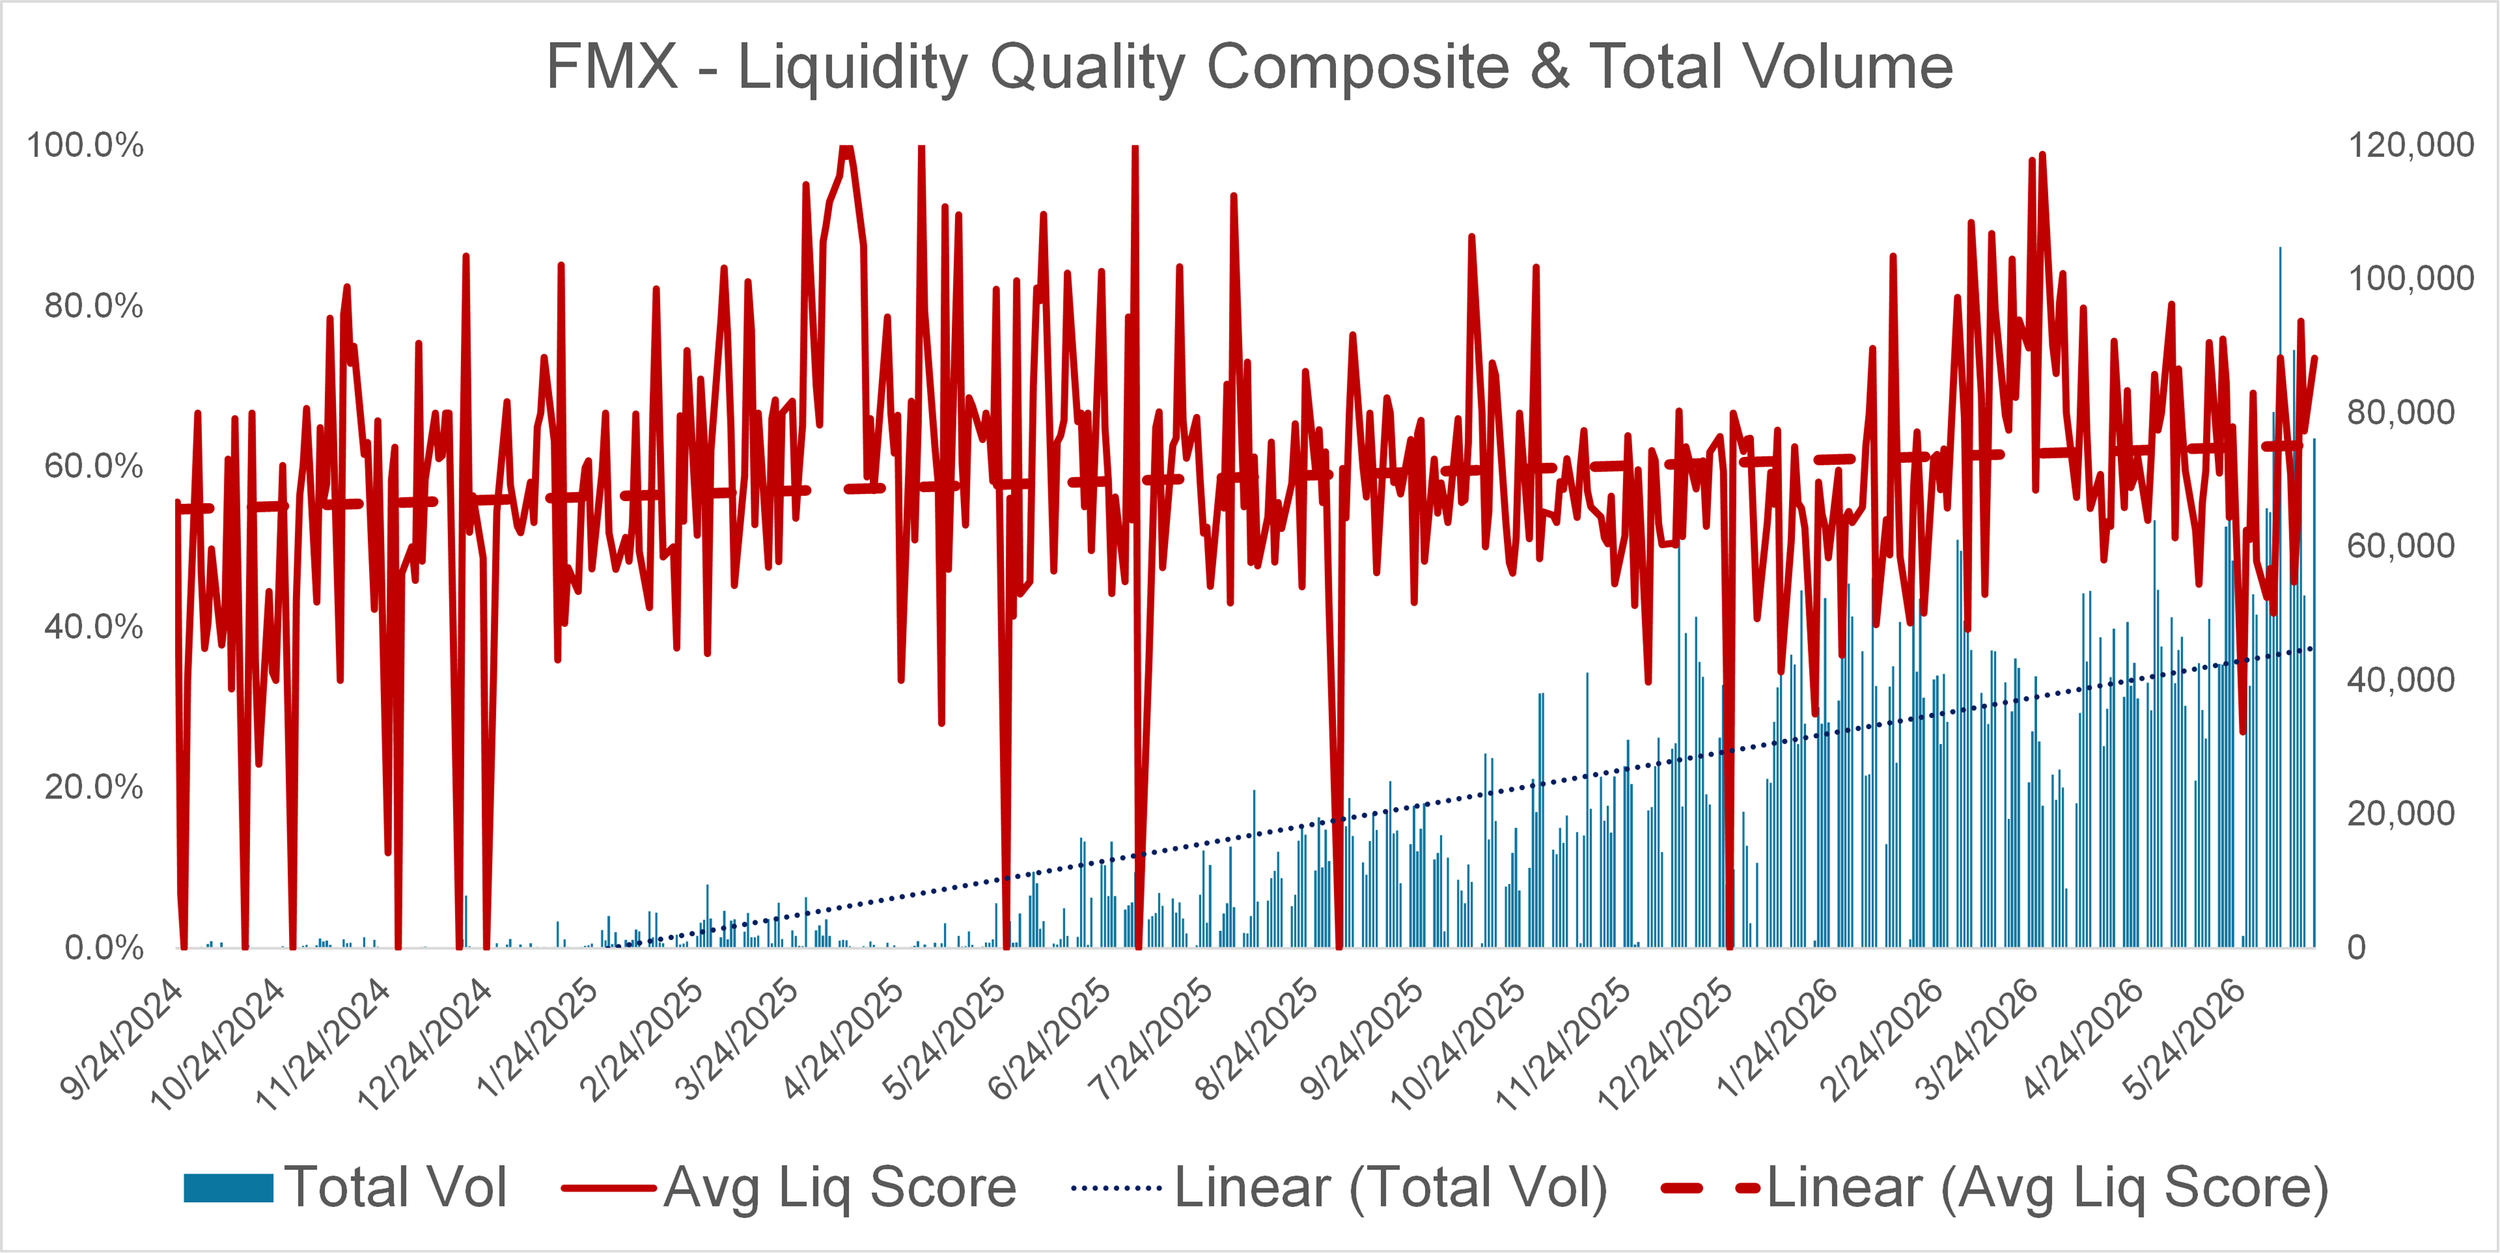
Source: Upslope chart and analysis based on FMX website data
Note: data range = 9/24/24 - 6/15/26
Two days
Given the above context, I think it’s useful to look more deeply at a couple of the more unusual trading days.
May 14, 2026 was Abaxx’s highest volume day ever, by far. On that day, 90% of volume was concentrated in two related contracts (likely calendar spread) that barely moved in price (~5 bps). Almost 100% of daily volume was seemingly “day-traded.” The estimated cost to traders (Abaxx revenue) to engage in this activity was $157k (per Abaxx Exchange Tracker). Abaxx formally announced its up-listing to TSX the prior day.
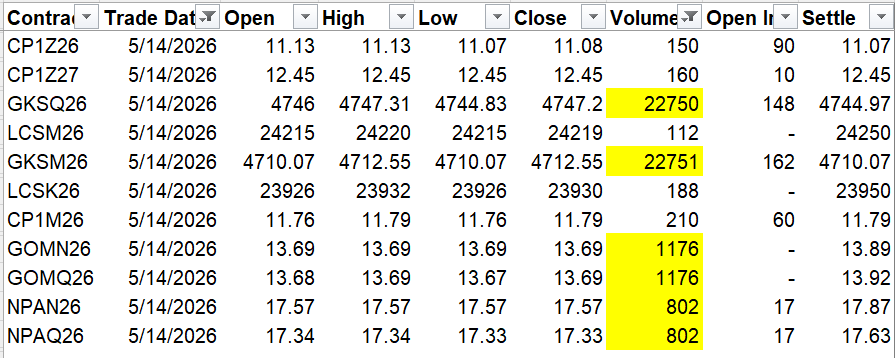
Source: Upslope, Abaxx website
May 25, 2026 was Abaxx’s 6th-best volume day ever and 4th-worst Liquidity Quality day ever, with Settle-Out, Day-Traded, and Low-Range shares all approaching 100%. The estimated cost to traders (Abaxx revenue) to engage in this activity was $121k (per Abaxx Exchange Tracker). Abaxx announced an equity raise the next day.
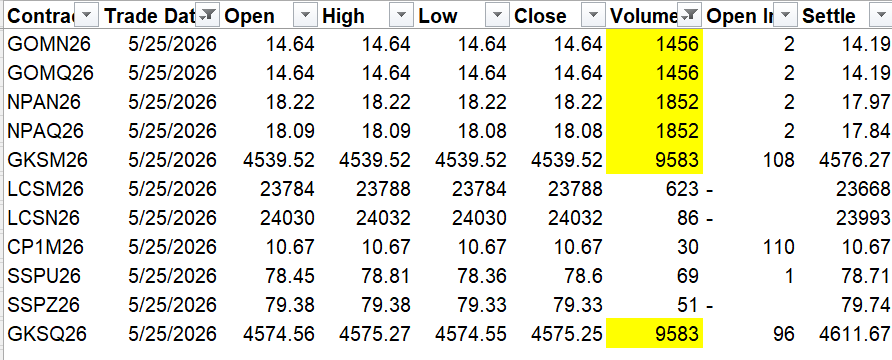
Source: Upslope, Abaxx website
Conclusion
Given all of the above, I see few signs of real ‘commercial’ traction on Abaxx’s exchange. Incentivizing volume growth is understandable, acceptable, and legal. But it is not value creating on its own (indeed, it must be funded). Actual value creation occurs if and when the exchange sees meaningful growth in independent, un-incentivized volumes and open interest. Without it, there is little fundamental value to this or any upstart exchange, in my view.
There may be legitimate explanations for why the data above paints the less-than-rosy picture that it does, though I am skeptical – especially given management’s commentary on their June 18 investor call, in which they said:
“Tell us about the quality of your trading. That's a bullsh*t metric. That's not a thing.” (Source: preliminary transcript via FactSet)
In my view, it’s ‘not a thing’ precisely because the liquidity quality data and trends look terrible today.
Finally, it’s possible that the data may change for the better in the future and Abaxx could prove to be a success. Unfortunately, the base rate for challenger exchanges succeeding is very low. And this is precisely why established exchanges – with genuine network effects – trade at a premium.
Disclaimer: as of this writing Upslope and its clients are short shares of Abaxx Technologies and stand to benefit if the share price declines. Upslope and its clients are also long shares of competing exchanges, including CME Group and MarketAxess. While Upslope has no present plans to do so, these positions may change at any time, without notice, and Upslope is under no obligation to update this post. Nothing here is investment advice or a recommendation to buy or sell any security. The analysis reflects Upslope’s opinions and is based on data believed to be reliable, but accuracy and completeness are not guaranteed. Do your own work.